In this tutorial, we will explore the three core trading strategies available in FX Magnetic RSI Trader: RSI Break-in, RSI Break-out, and RSI-SMA. Each strategy comes with multiple variations which can help you take advantage of different market conditions and get better trading results in the process.
This guide will jumpstart your progress with FX Magnetic RSI Trader so you can start utilizing its capabilities effectively.
Built-In Trading Strategies Quick Look
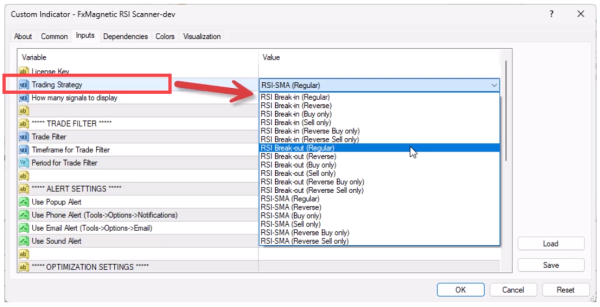
- RSI Break-in
- Modes: Regular, Reverse, Buy Only, Sell Only.
- RSI Break-out
- Modes: Regular, Reverse, Buy Only, Sell Only.
- RSI-SMA
- Modes: Regular, Reverse, Buy only, Sell only.
What Is RSI?
The Relative Strength Index (RSI) is an oscillator type indicator used to identify overbought and oversold zones. Important things to understand:
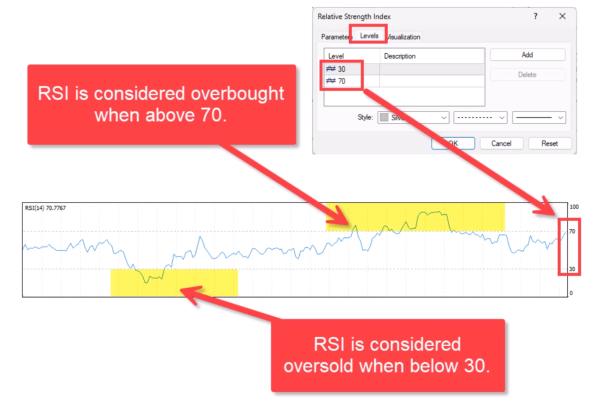
- RSI levels range from 0 to 100.
- Standard overbought level is 70 (customizable).
- Standard oversold level is 30 (customizable).
- These levels can be adjusted (e.g., 20/80 or 10/90) based on your strategy.
- Price reaching these levels hints a possible reversal.
Understanding the Scanner
The Scanner serves as the analytical engine, processing market data and generating signals based on your configured parameters.
It can operate independently without a visual indicator. Though optional, we suggest you add the built-in Metatrader RSI indicator.
Using both in tandem is a great way to visually verify the Scanner’s decision-making process.
The auto-trader that comes with the software is a great addition for when you find the parameters that work for you, and want to automate your trading.
Scanner Configuration
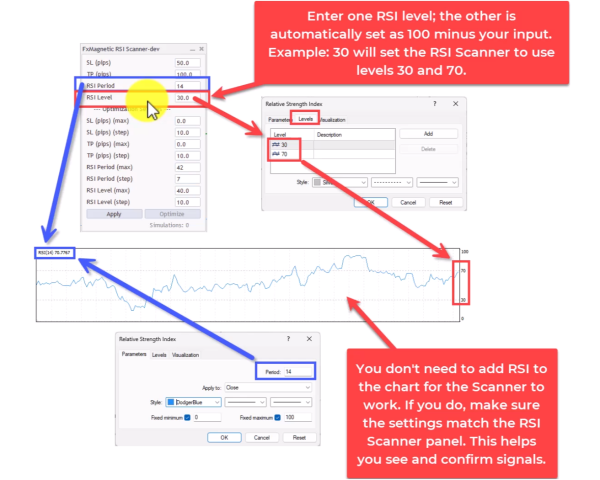
The Scanner’s configuration panel presents several critical parameters that define your trading approach:
- RSI Period: Determines the lookback period for calculating relative strength.
- RSI Level: Sets the threshold for overbought/oversold conditions.
- Strategy Selection: Choose between Breakin, Breakout, or RSI-SMA approaches.
- Trade Direction: Regular, Reverse, or directional-only modes.
Each parameter can significantly impact your trading results, making proper configuration essential for optimal performance.
Trading Modes
Each strategy can be used in different modes:
Regular Mode
- Takes both buy and sell trades.
- Closes existing trades when an opposite signal appears.
- Only one trade opens at a time.
Reverse Mode
- Takes opposite trades from what the strategy indicates.
- Example: Take sell trade when strategy shows buy signal.
Buy Only Mode
- Only takes buy trades.
- Hold until stop loss or take profit.
- Ignores sell signals.
Sell Only Mode
- Only takes sell trades.
- Hold until stop loss or take profit.
- Ignores buy signals.
Reverse Buy Only Mode
- Only looks for buy signals but takes sell trades instead.
Reverse Sell Only Mode
- Only looks for sell signals but takes buy trades instead
Strategy Deep Dive
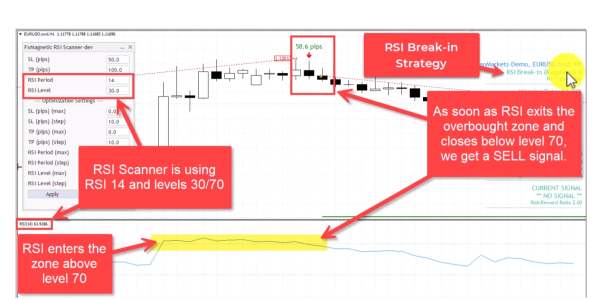
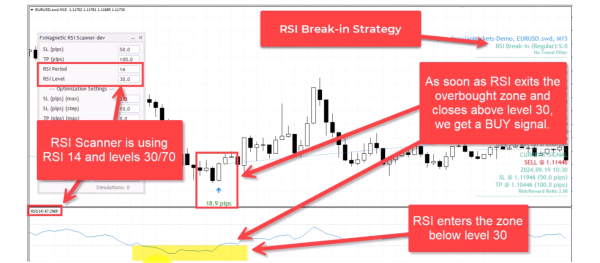
1. RSI Break-in Strategy (Regular Mode)
This strategy waits for price to exit the overbought or oversold zone and into the area between 30 to 70, hence “break-in”.
- The RSI Scanner is set to use an RSI period of 14 with levels 30 (for oversold) and 70 (for overbought).
- A SELL signal is triggered when the RSI enters the overbought zone (above 70) and then falls back below level 70.
- A BUY signal is triggered when the RSI enters the oversold zone (below 30) and then rises back above level 30.
2. RSI Breakout Strategy (Regular Mode)
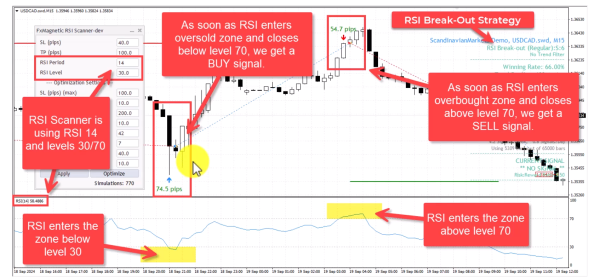
Opposite of the break-in strategy, this waits for the price to exit the area between 30 to 70.
- The RSI Scanner is set to use an RSI period of 14 with levels 30 (for oversold) and 70 (for overbought).
- A SELL signal is triggered when the RSI enters the overbought zone (above 70).
- A BUY signal is triggered when the RSI enters the oversold zone (below 30).
3. RSI-SMA Strategy (Regular Mode)
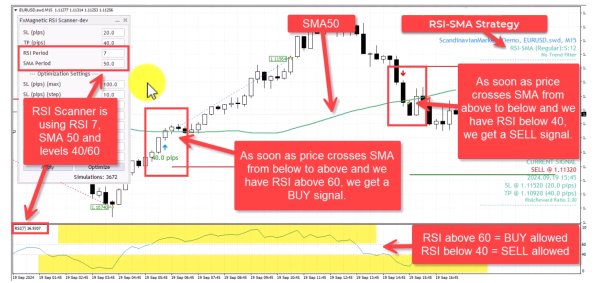
Combines RSI strategy with a Simple Moving Average (SMA) to filter trade signals.
- The RSI Scanner is set to use an RSI period of 7 and SMA period 50.
- The system will use RSI levels 40 (for downtrend) and 60 (for uptrend). We cannot change or optimize these levels, but we can optimize RSI and SMA period.
- A SELL signal is triggered when the price crosses SMA from above to below and RSI is below 40.
- A BUY signal is triggered when the price crosses SMA from below to above and RSI is above 60.
Important Trading Rules
- The software opens one trade at a time per strategy for better risk management. If you need more than one trade for some reason, you can attach the software on another chart.
- For regular/reverse modes, new opposite signals close existing trades.
- For “only” modes, trades run until stop loss or take profit.
- You can use trend filters for additional confirmation.
- Consider reoptimizing the parameters or exploring other modes if experiencing more consecutive losses than historically normal.
Monitoring Performance
Track these key metrics:
- Win rate percentage
- Maximum consecutive losses
- Return to drawdown ratio
- Total pips/points gained
- Drawdown percentage
Understanding your numbers is crucial to your trading success. Remember, FxMagnetic can only help speed up your strategy development. Your outcomes would still depend on how well you use the software.
Tips for Success
- When starting out, we recommend you use the built-in RSI indicator from MT4 as visual confirmation for the scanner. Just remember to match RSI settings on both.
- Monitor max consecutive losses as indicator for the strategy viability.
- Consider using trend filters (such as the SMA) or monitor higher time frames to know the overall trend.
- Regularly optimizing the settings is a good practice to adapt to changes in market conditions.
- To better understand how the indicator and scanner work, we highly recommend you watch the tutorial.
