In this tutorial, we will guide you on quickly re-optimizing your trading strategy settings in under 5 minutes using the FxMagnetic indicator.
Introduction
When you switch to a different account and a different broker, you are faced with new market conditions. In this tutorial, you will learn how to optimize your settings to align with new conditions. Using the FxMagnetic indicator, we’ll show you how to optimize your settings in under five minutes. The goal is to adapt your trading settings so that you can maintain or improve upon your previous success rates and profitability. Whether you are looking to replicate previous outcomes or enhance them, this guide will equip you with the necessary steps to optimize performance swiftly and efficiently.
Scenario
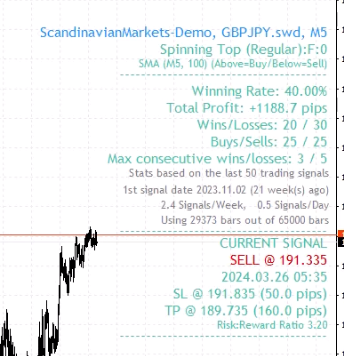
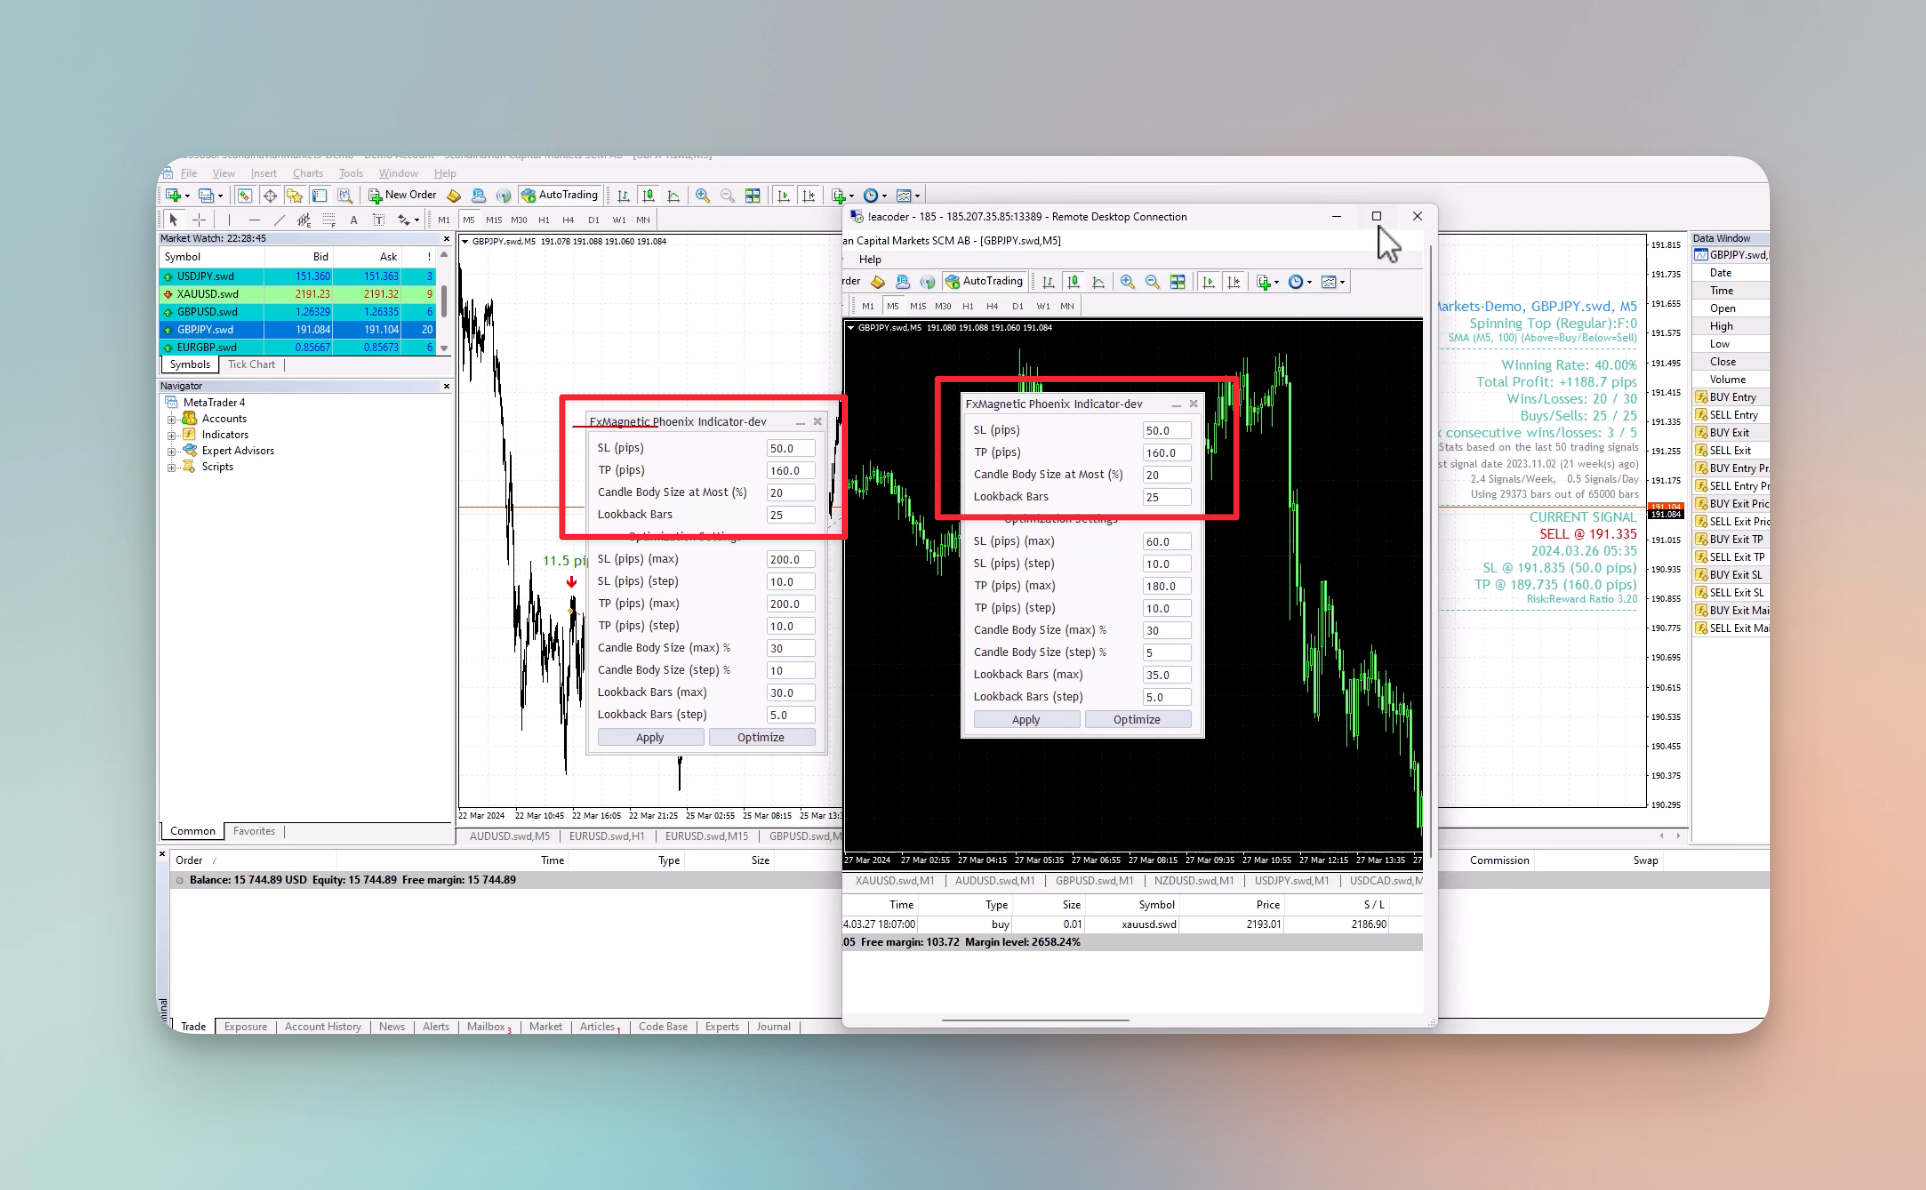
For this demonstration, we are using MetaTrader 4 with the FX Magnetic Phoenix indicator on the GBP/JPY 5-minute chart, which initially shows a 40% win rate and a total profit of +1188.7 pips.
Now, imagine we want to apply these settings on a different trading account with another broker. The following step-by-step tutorial will teach you how to optimize your indicator settings on a different trading account with another broker in under 5 minutes.
Note: The following process applies universally across different brokers.
Handling Insufficient Price Bars
The optimization process detailed above should work with any broker, considering you have enough price bars. In case you do not have sufficient price bars, you can download additional bars from the broker. If your broker does not provide enough history data then you can download the data from the Tools=> and History Center, as detailed in the following tutorial (add tutorial link).
Step-by-Step Tutorial
Step 1: Open the New Account
Step 2: Attach the Indicator
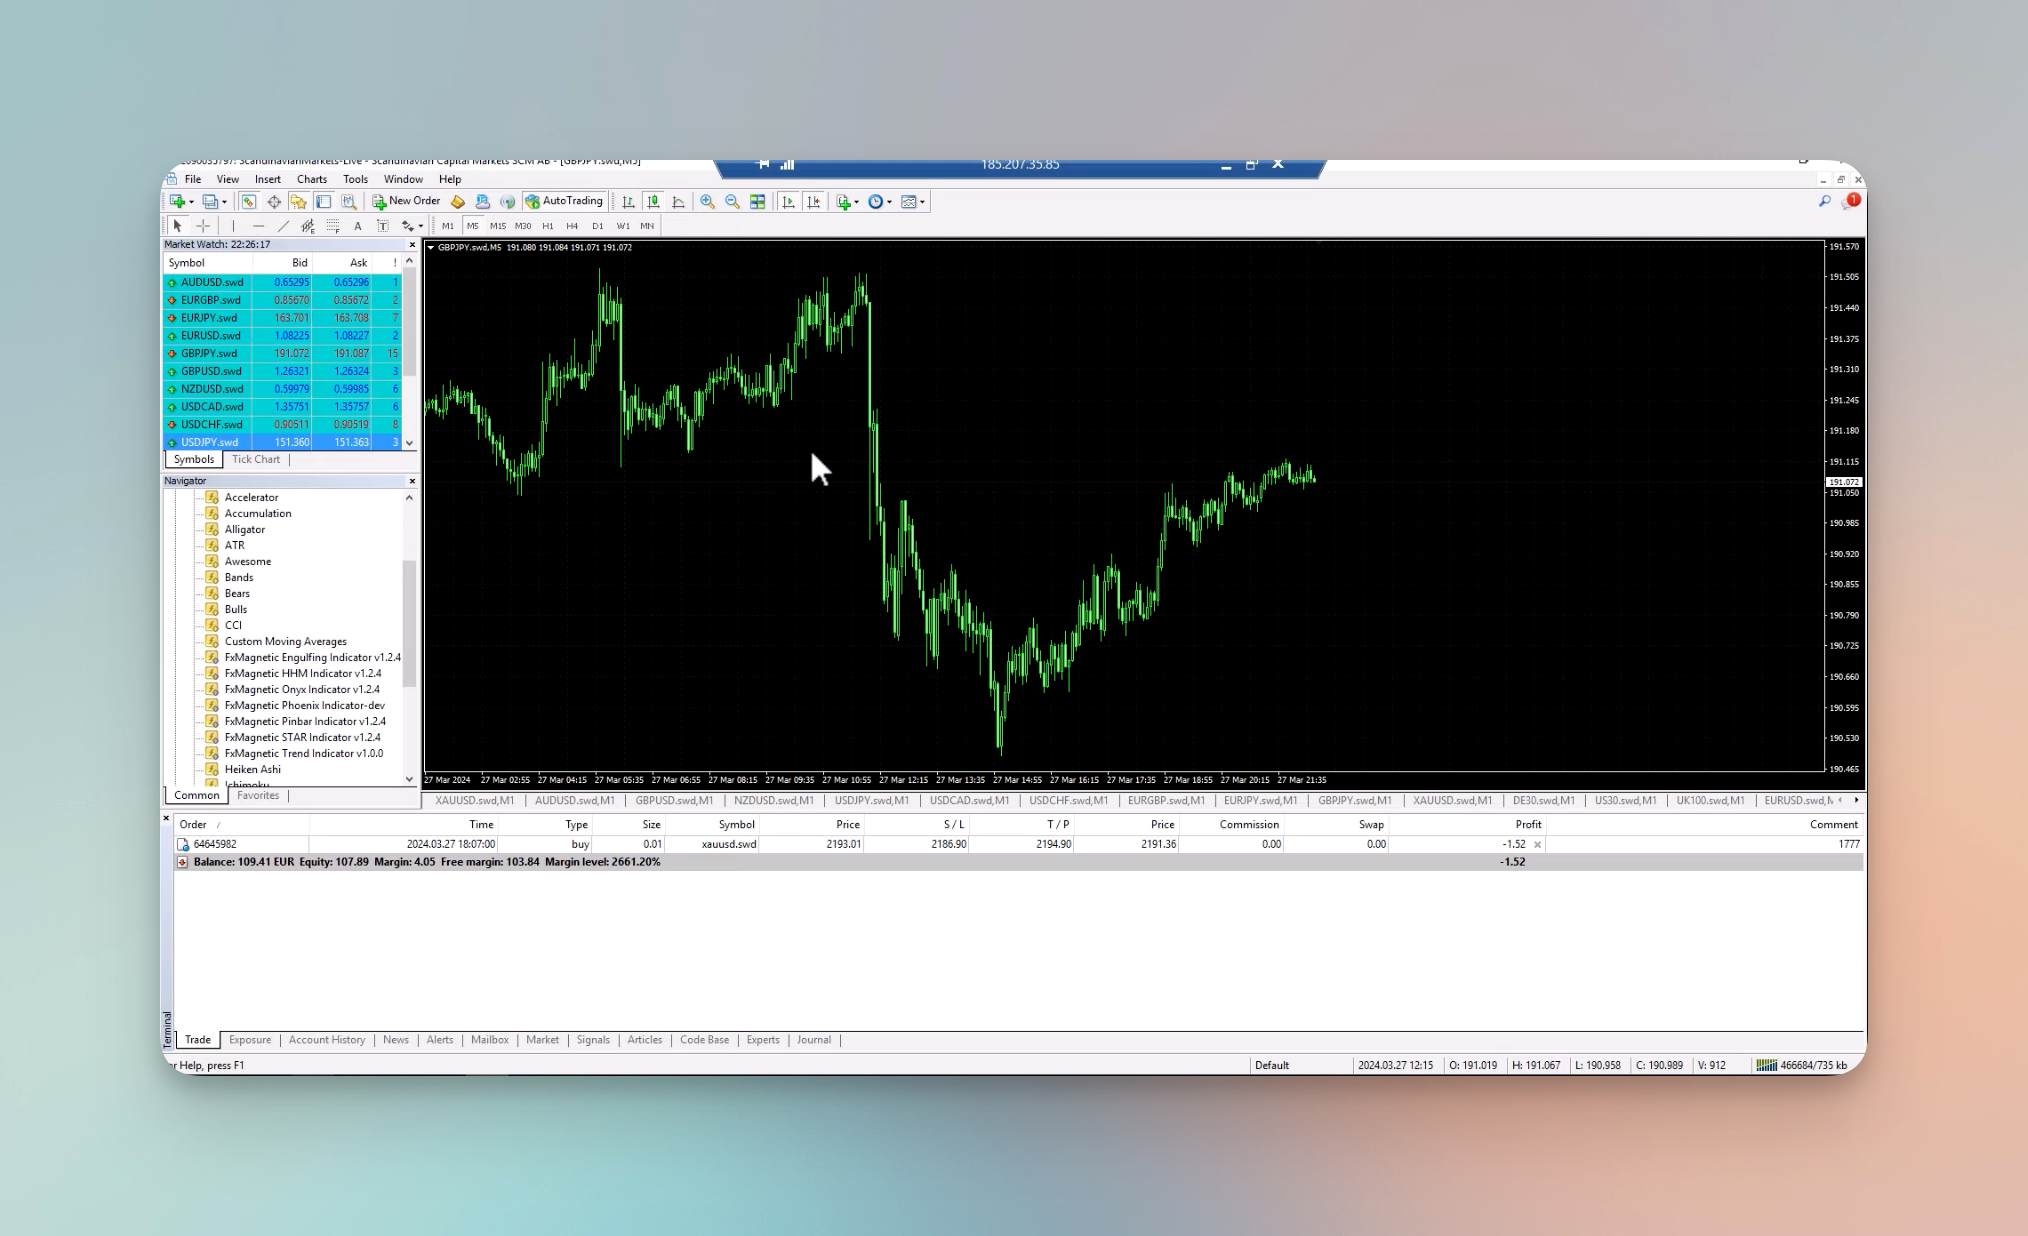
Apply the FxMagnetix Phoenix indicator to your chart by dragging and dropping it on the chart.
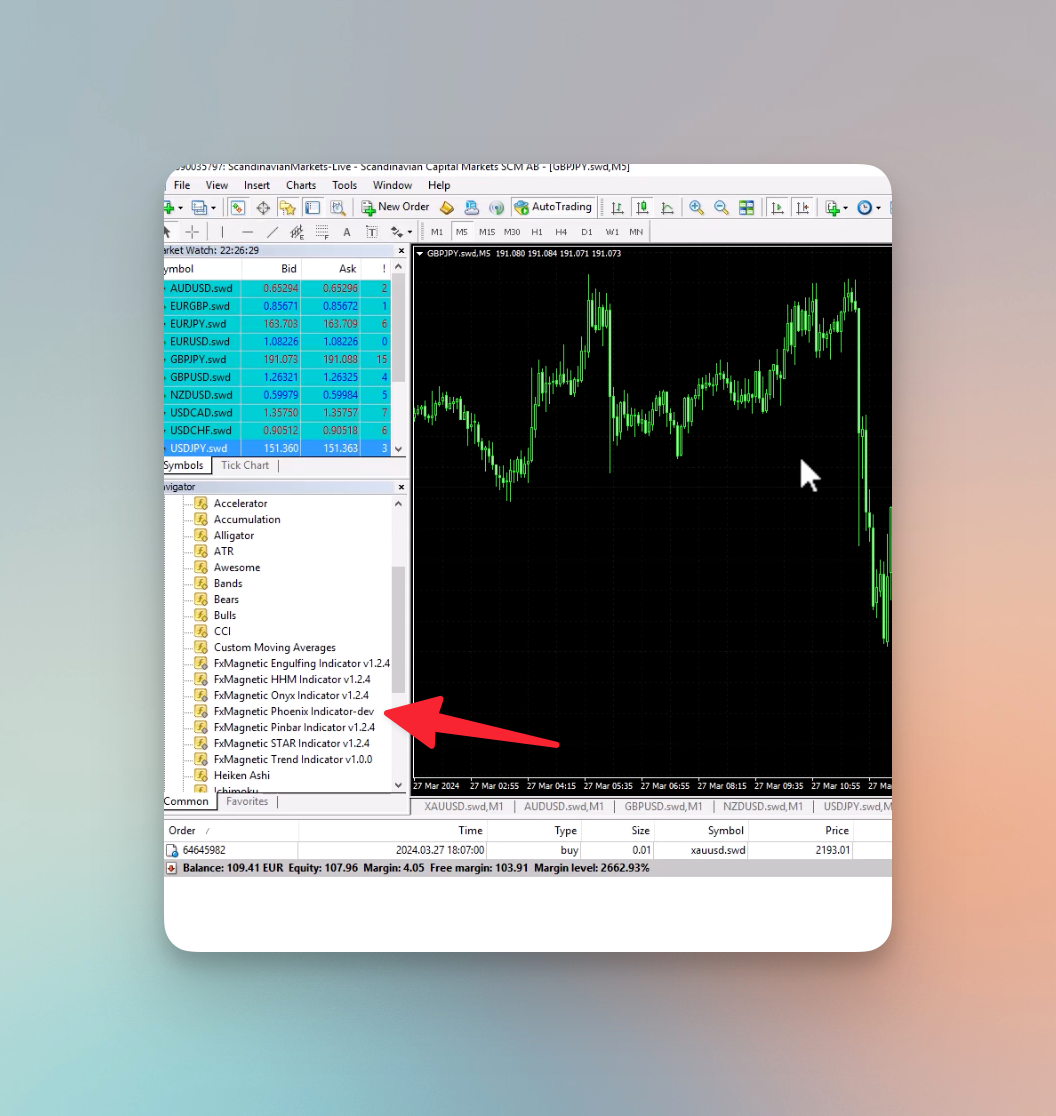
Step 3: Set the Parameters
Configure the indicator’s settings by referencing the settings on the previous chart:
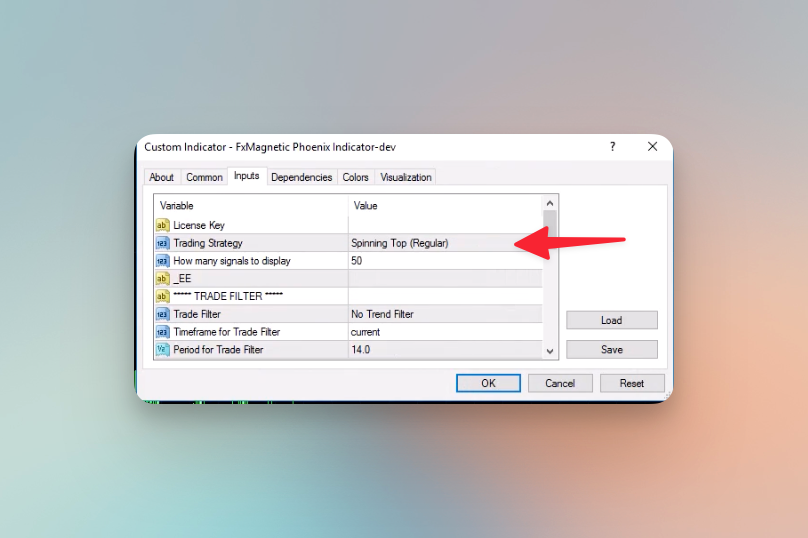
- We can see from the previous chart that the Trading Strategy is set to Spinning Top (Regular), so we will set the Trading Strategy to Spinning Top (Regular) here as well.
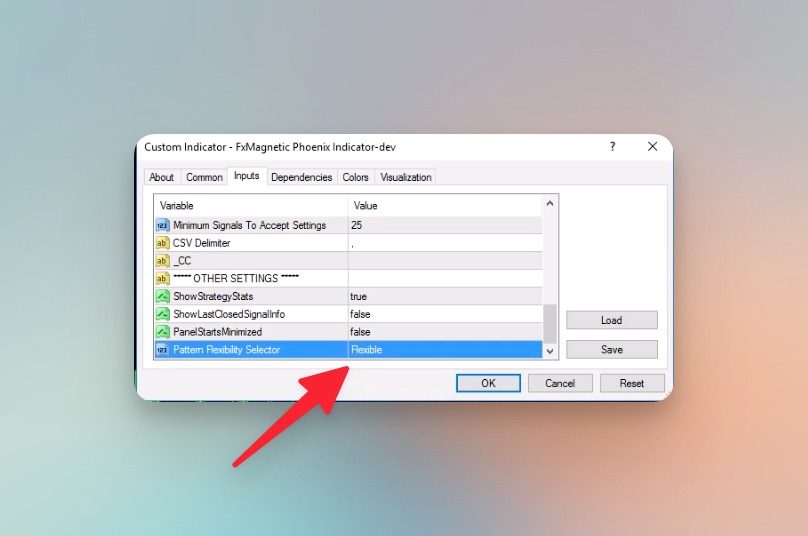
- On our previous chart, we can see the letter “F” after “Spinning Top (Regular)” which means the Pattern Flexibility Selector is set to Flexible. So, we’ll set our Pattern Flexibility Selector to Flexible here as well.
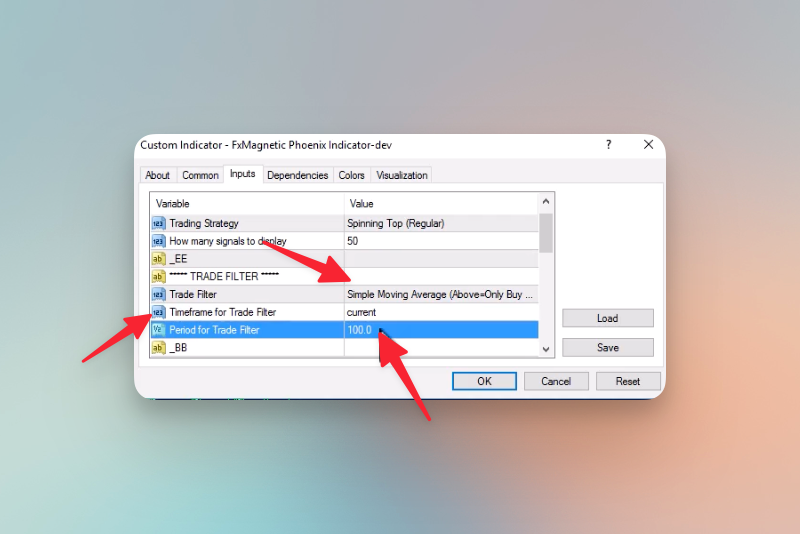
- Then, we’ll set the Trade Filter to Simple Moving Average (SMA), the Timeframe for Trade Filter to current, and the Period for Trade filter to 100.
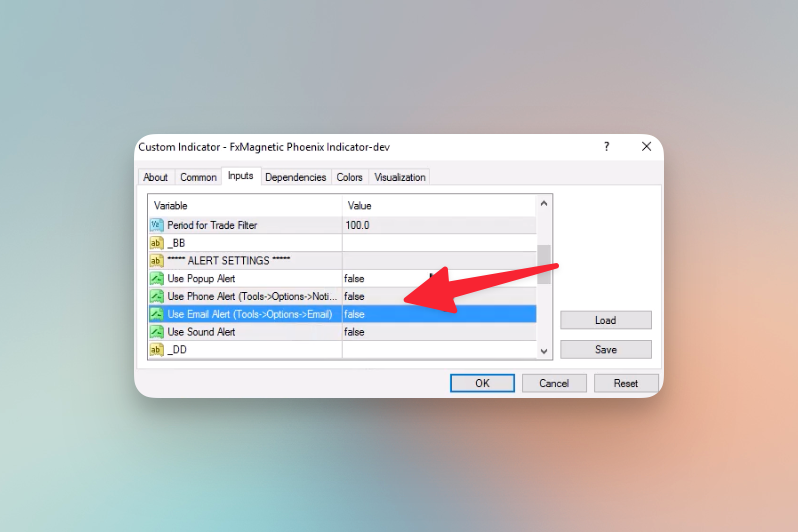
- Next, we can Disable Alerts (Optional).
Step 4: Prepare for optimization
After the settings above, we will prepare for the optimization in advance by setting limits. Because, during the optimization, we want the indicator to only pick the results within the following parameters:
- A Risk to Reward Ratio between 1.5 and 4. So, we will set the:
- Minimum Risk:Reward Ratio to 1.5.
- Maximum Risk:Reward Ratio to 4.
- Minimum 50 signals on the chart so that the optimization gets accepted. So, we will set the Minimum Signals to Accept Settings at 50.
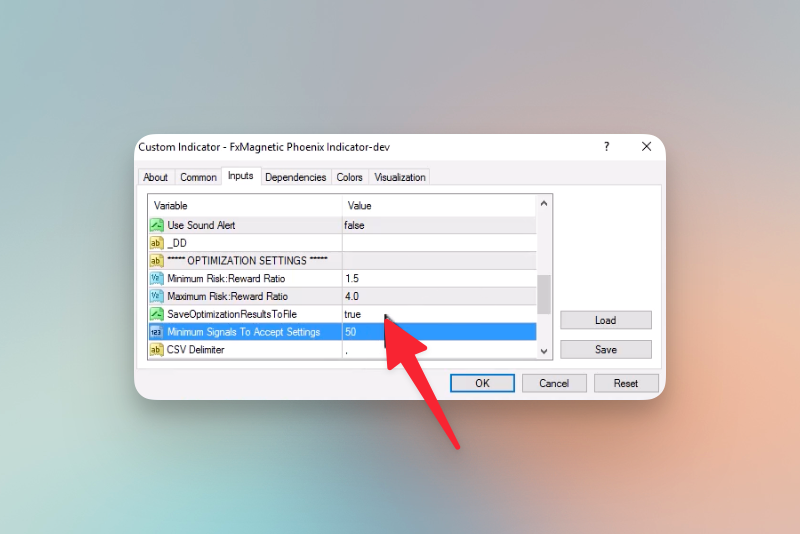
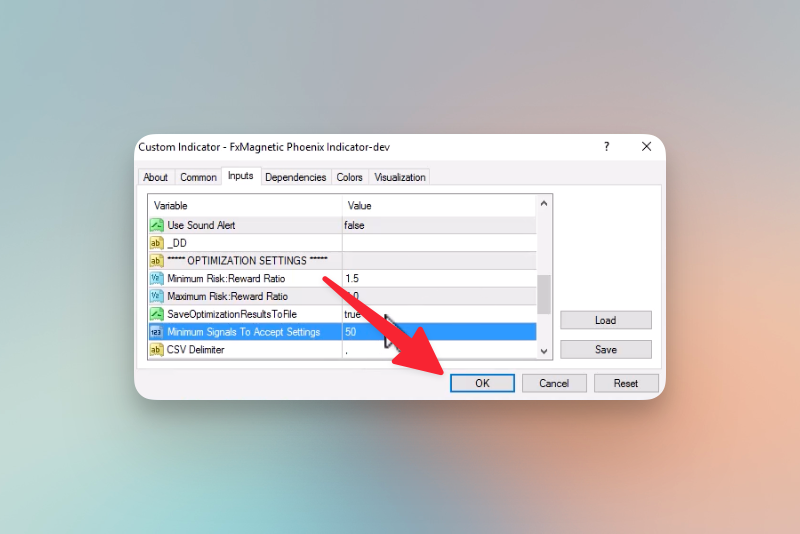
Finally, click OK to load the indicator with these settings.
Step 5: Configure the Indicator
- After clicking OK, the indicator will load onto the chart as follows:
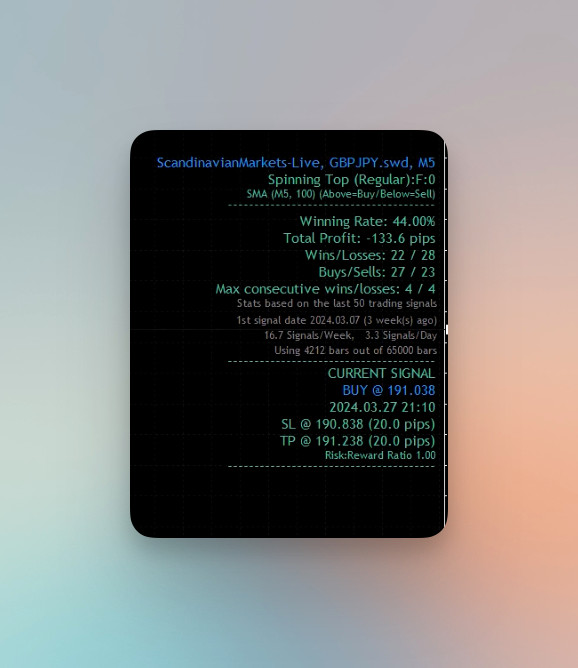
- And, the Stats will appear as well:
- If the settings don’t match the expected settings from the previous chart, re-input the settings from the previous chart, as follows:
- SL (pips): 50
- TP (pips): 160
- Candle Body Size at Most (%): 20
-
Lookback Bars: 25
- After inputting the stats, we will compare the results. In this case, they do not match, since we have a 40% win rate and a Total Profit of only +755.4 pips.
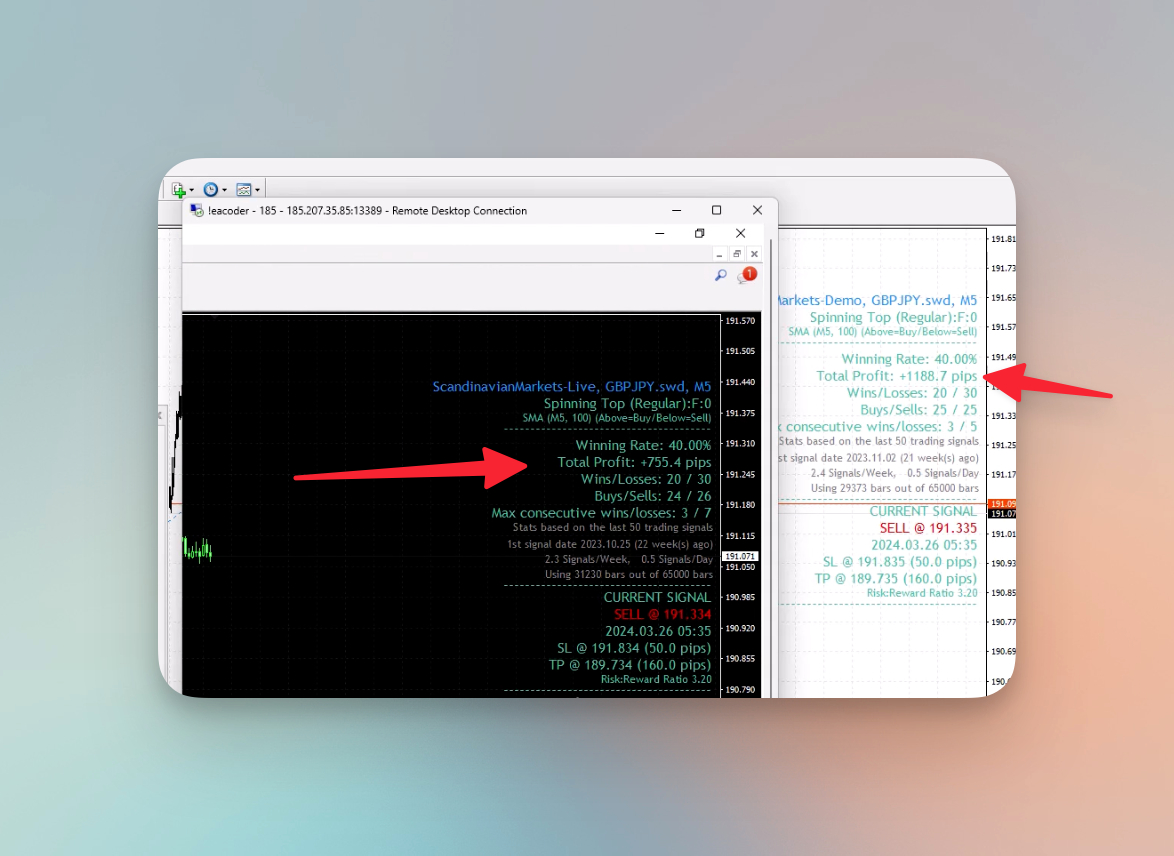
Now, that we have compared, and although it is similar, it is not exactly the same. In most cases, if it’s a different broker, you will likely never get the same results because different price feeds create candlestick patterns at different places. It is known as a Broker Data Paradox and we have a tutorial on this topic as well.
So, on one feed there may be one candlestick, but on the other, there wouldn’t be, or it would be created a little later. So, although there will always be some mismatches, we can try to make it as close as possible.
The next step is to start the optimization process and achieve better results.
Optimization Process
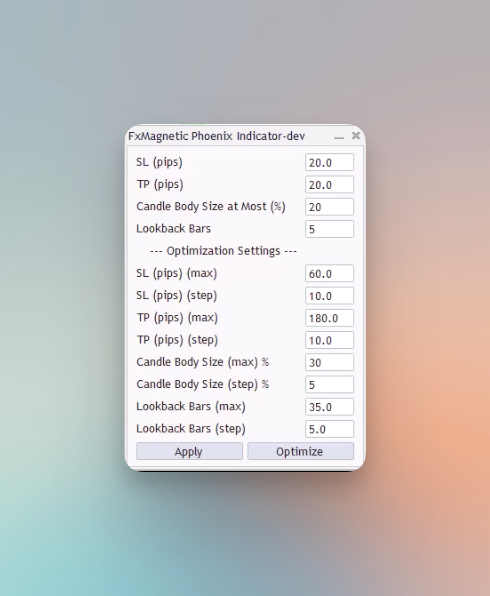
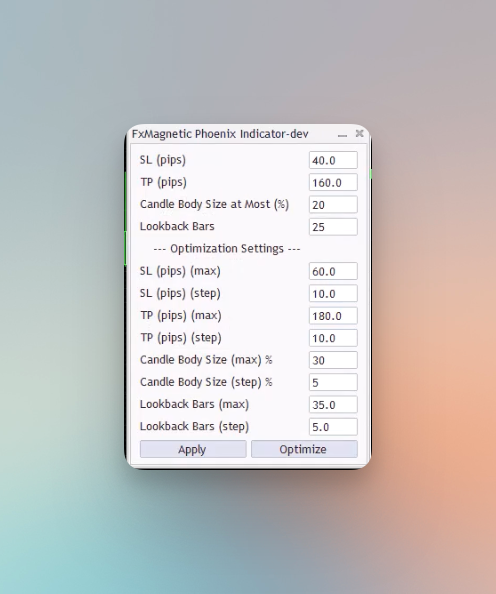
We will begin by observing our indicator. We have the following settings at the moment:
- SL (pips): 50
- TP (pips): 160
- Candle Body Size at Most (%): 20
- Lookback Bars: 5
Now, for the optimization, we want to test around our current SL, TP, Candle Body Size, and Lookback Bars settings. For that, we will calculate the percentages around our existing settings and use the results for optimization.
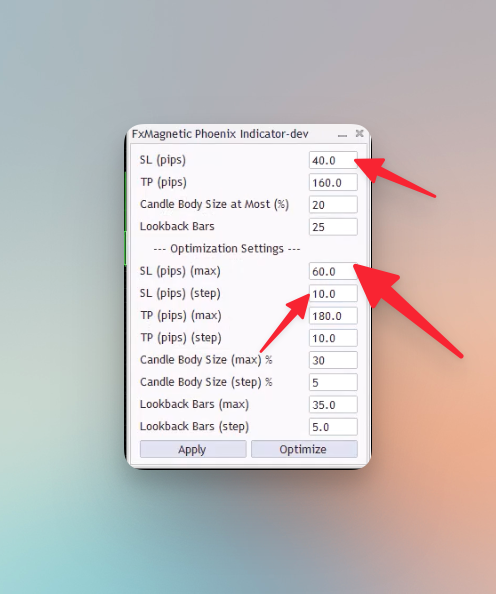
Adjusting Stop Loss
We will start by adjusting our Stop Loss. We will adjust around the original 50 pips by scanning from 40 to 60 pips in increments of 10.
- Original Stop Loss: 50 pips
- Calculation of Range:
- Decrease by 20%: 50 pips – (20% of 50 pips) = 50 pips – 10 pips = 40 pips
- Increase by 20%: 50 pips + (20% of 50 pips) = 50 pips + 10 pips = 60 pips
- Scanning Range: From 40 to 60 pips, using steps of 10 pips. This means the settings will be tested at 40, 50, and 60 pips to find the optimal setting.
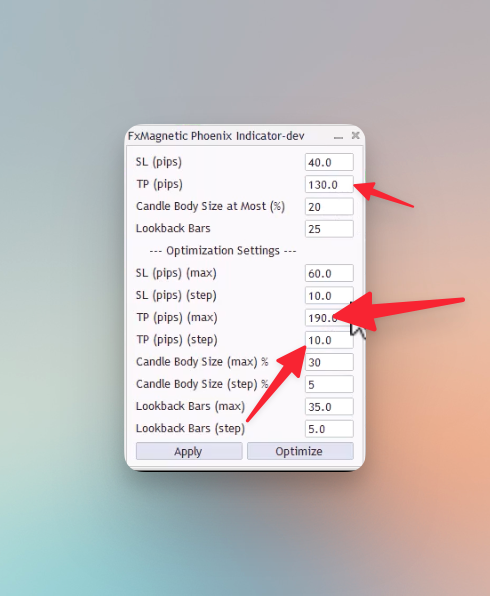
Adjusting Take Profit
Next, we will adjust our Take Profit. We will adjust around the original 160 pips by scanning from 130 to 190 pips in increments of 10.
- Original Take Profit: 160 pips
- Calculation of Range:
- Decrease by 20%: 160 pips – (20% of 160 pips) = 160 pips – 32 pips = 128 pips. We round this to 130 pips for simplicity.
- Increase by 20%: 160 pips + (20% of 160 pips) = 160 pips + 32 pips = 192 pips. We round this to 190 pips for simplicity.
- Scanning Range: From 130 to 190 pips, in increments of 10 pips (130, 140, 150, 160, 170, 180, 190).
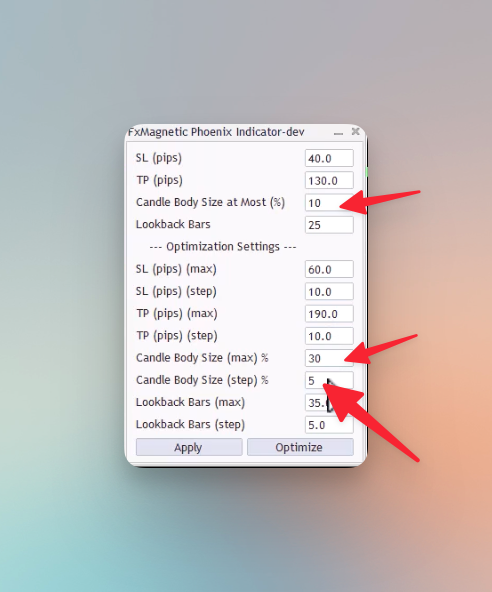
Adjusting Candle Body Size
After adjusting our take profit, we will adjust the Candle Body Size. We will scan from 10 to 30 with a step of 5.
- Original Candle Body Size: 20 pips
- Calculation of Range:
- Decrease by 50%: 20 pips – (50% of 20 pips) = 20 pips – 10 pips = 10 pips
- Increase by 50%: 20 pips + (50% of 20 pips) = 20 pips + 10 pips = 30 pips
- Scanning Range: From 10 to 30 pips, using steps of 5 pips. This means the settings will be tested at 10, 15, 20, 25, and 30 pips to find the optimal setting.
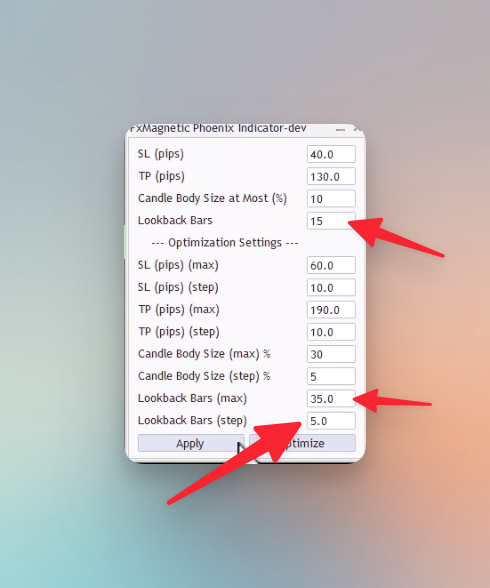
Adjusting Lookback Bars
Finally, we will adjust the Lookback Bars by scanning from 15 to 35 with a step of 5.
- Original Lookback Bars: 25 bars
- Calculation of Range:
- Decrease by 40%: 25 bars – (40% of 25 bars) = 25 bars – 10 bars = 15 bars
- Increase by 40%: 25 bars + (40% of 25 bars) = 25 bars + 10 bars = 35 bars
- Scanning Range: From 15 to 35 bars, using steps of 5 bars. This approach tests settings at 15, 20, 25, 30, and 35 bars to identify the best configuration.
Click apply to apply the settings. Once, we have applied the settings, we can start the optimization to improve the strategy.
Final Comparison
After the optimization starts, it should not take more than a few minutes to load the results. Comparing the results below, we can observe that the Total Profit in the new account is very close (only a 10 pips difference), and the winning rate has risen by 4% to a total of 44%.
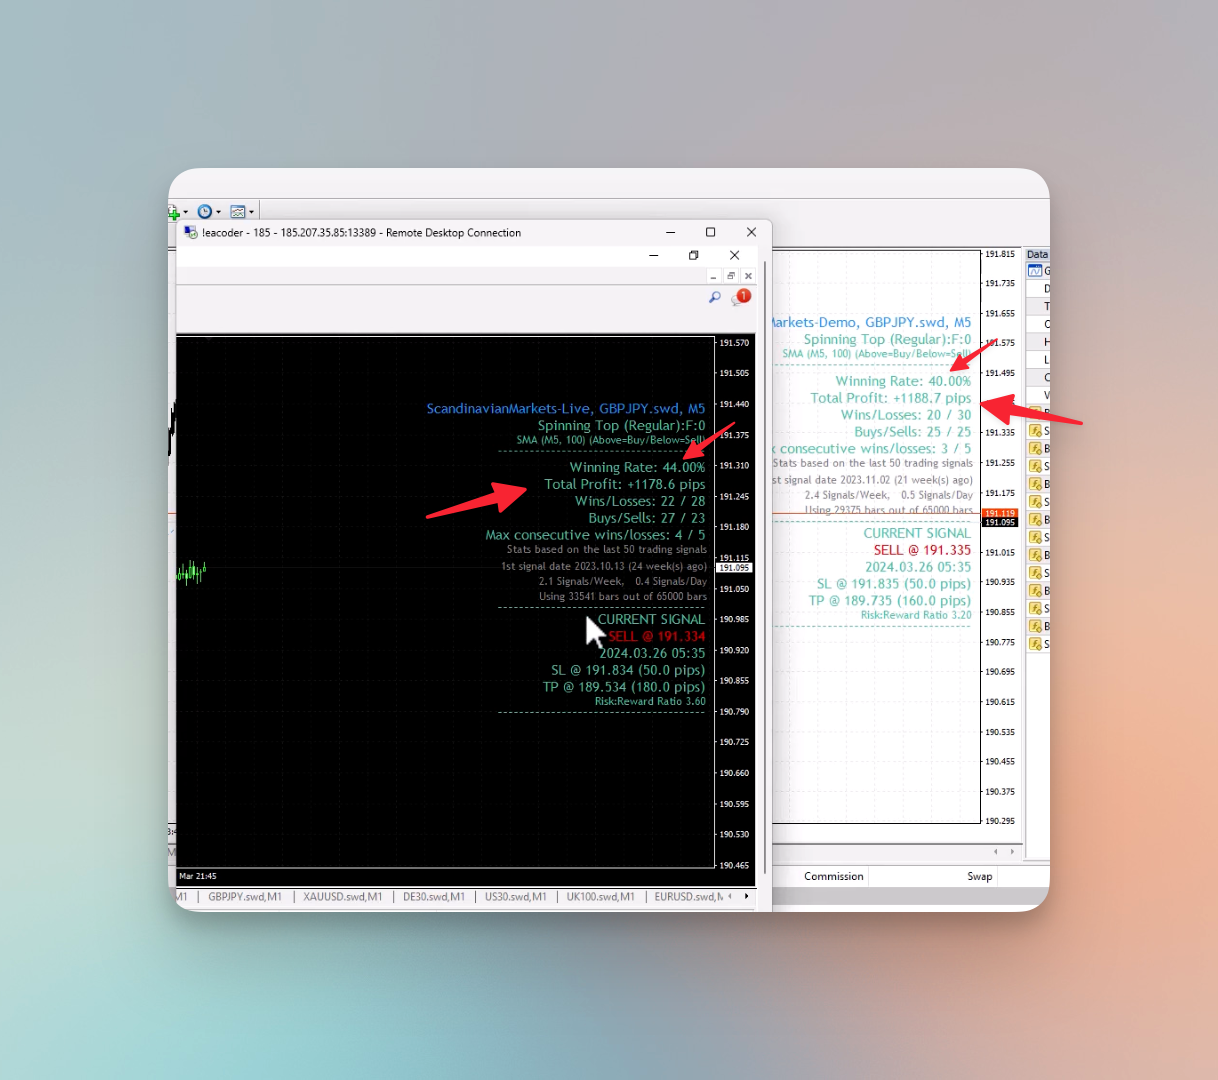
While you may not achieve 100% identical results across different brokers or account types, the goal is to get as close as possible, or even improve upon them.
Conclusion
By now, you should have a clear understanding of how to adjust various parameters such as Stop Loss, Take Profit, Candle Body Size, and Lookback Bars to closely match or improve upon your existing strategy’s performance. While identical results across different brokers are not guaranteed due to variations in price feeds and market conditions, the techniques you’ve learned today will enable you to maximize your strategy’s effectiveness in any trading environment. Continue to apply these principles consistently, and always seek to refine your approach based on market feedback and performance analysis. The key to successful trading lies in continual improvement and adaptation.
Next Chapter…