In this tutorial, we will explore the comprehensive suite of candlestick pattern trading strategies available in FX Magnetic Candlestick Labs. This software combines six specialized scanners to help you leverage tried and tested candlestick patterns for a more effective trading.
You’ll learn how to set up, optimize, and develop strategies for each pattern type, from basic platform configuration to advanced portfolio management.
This guide breaks down the process to help both new and experienced traders make the most of Candlestick Labs’ features.
Initial Setup Checklist
Before beginning any strategy development, access the setup checklist from the download center in your course access section. This document guides the entire setup and optimization process.

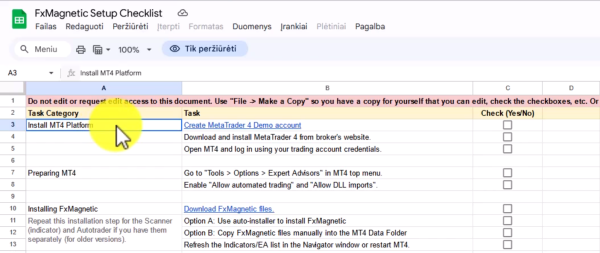
To Access Download Center:
- Log into your account.
- Click Access Course.
- Locate Setup Checklist document.
- Upon opening the document, click File then Make A Copy.
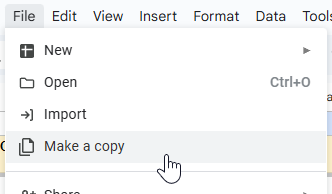
- Save the copy in your own Google Drive.
- Use this checklist as your guide as you progress
Downloading And Installing FxMagnetic Software
The installation process for any FxMagnetic Software (i.e: Candlestick, RSI, BB, MACD, etc.) is similar. You can read more about it here.
Preparing Historical Data
Sufficient historical data is essential for accurate backtesting and strategy optimization. Without this, the potential of the software and backtesting results will be limited, and we don’t want that.

Chart Preparation:
- Open desired trading pair chart
- Select preferred time frame
- Turn off Auto Scroll
- Zoom out to load more candles in the chart.
- Press and hold the Home button on your keyboard to scroll back to the oldest available data.
- Wait for all the data to load.
- Once done, re-enable Auto Scroll for it to return to the present data.
How Candlestick Labs Was Born

FxMagnetic’s journey began in 2023 with the creation of HHM (Hammer & Hanging Man) Scanner, which quickly gained popularity among traders due to its usefulness to easily spot candle patterns.
Following its success, we decided to add more:
- FxMagnetic™ HHM (Hammer & Hanging Man)
- FxMagnetic™ Pinbar
- FxMagnetic™ Engulfing
- FxMagnetic™ STAR
- FxMagnetic™ Phoenix (Spinning Tops & Doji)
- FxMagnetic™ Onyx (Three White Soldiers & Three Black Crows)
Each scanner shares similar modes and functionalities for backtesting, strategy discovery, optimization, and automation. By merging these specialized tools, Candlestick Labs was born – a powerful candle pattern detection tool created for Metatrader.
Candlestick Labs Scanner Setup
Before starting, ensure the Candlestick Scanner is properly installed in your MT4 platform:
- Find the Scanner in the Navigator window under Indicators in the MT4 platform.
- To access, click on View and Navigator
- Double-click or drag the indicator to chart.
- Input License Key.
- Initially, we suggest you start with the Regular strategy.
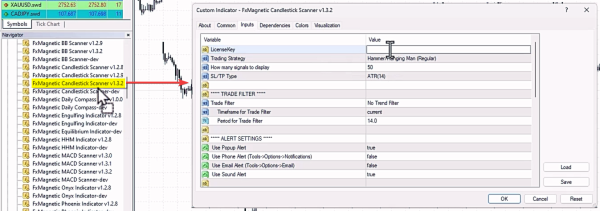
Building Your Trading Strategy
This software gives you the freedom to try hundreds of different settings. However, to get you started in the right direction, here is an example setting you can try.
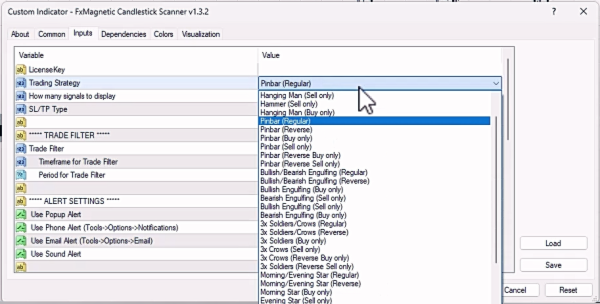
- We suggest you start out with the Pinbar Regular first.
- For SL/TP Type,choose ATR 14 which is the dynamic version.
- Click OK once these are selected.
- This will take you to your chart where a small panel will appear.
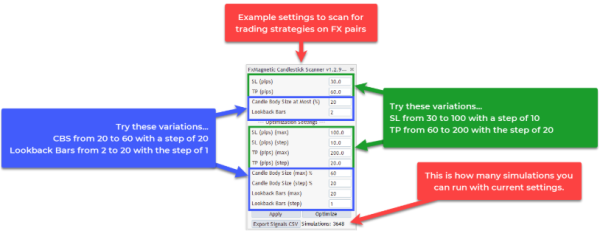
Set the following Parameter Ranges. Here’s an example settings that’s applicable for all pairs and timeframes:
- SL (ATR multiplier) from 1 to 5 with the step of 1.
- TP (ATR multiplier) from 2 to 15 with the step of 1.
- Candle Body Size from 20 to 60 with a step of 20.
- Look Back Bars from 2 to 20 with a step of 1.
Explanation:
- In this configuration, we use the ATR (14) or Average True Range to measure the average candle movement 14 periods back.
- This number is used to measure the stop loss and take profit value.
- The candle body size (%) determines if the candle pattern scanned is to be considered as a signal, or not, depending on the size of the candle’s body relative to the overall size.
- The Look Back Bars parameter helps to filter out noise. It does this by limiting the number of patterns read looking back.
You can see more sample settings in this cheat sheet. It’s important to understand that this is just the initial step and you are most likely to find better settings that are more profitable after you optimize.
Optimizing Your Strategy
The software will test different values within the parameter range to find one with the best result. Approximately, it will run 3,000 simulations depending on your settings, and takes around 10 to 30 minutes depending on your computer.

Preparation:
- We recommend you close unnecessary MT4 charts to improve processing speed. Closing other programs running on your computer can help the optimization to finish faster.
- Set your initial parameters ranges. Do keep a record of the parameter you are currently testing.
- Once you are ready, click Optimize and Start Now?
Reviewing The Results (Important!)
The values seen on your chart after the optimization provides an overview of how the strategy’s parameters performed. This alone could help you decide how you will move forward.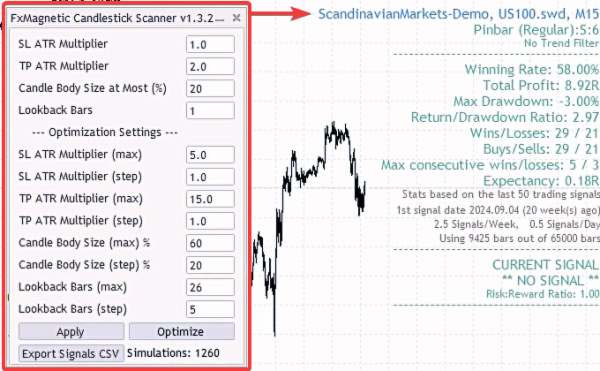
You can also go in depth by viewing the full stat of the strategy. To view the record:
- Go to File then Open Data Folder.
- Inside the Data Folder, go to MQL then File folder.
- Look for the folder of the FxMagnetic scanner you are using on open.
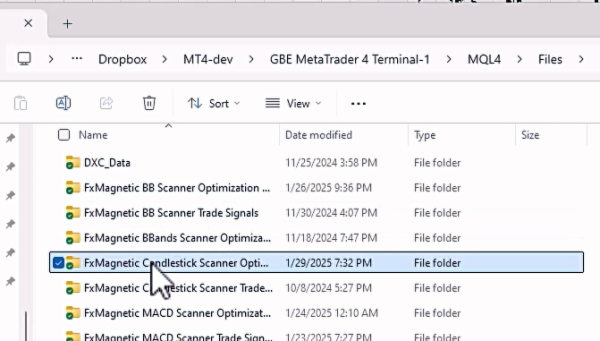
- Open the latest spreadsheet file to see the strategy’s data. This file can be viewed in both Excel and Google Sheets.
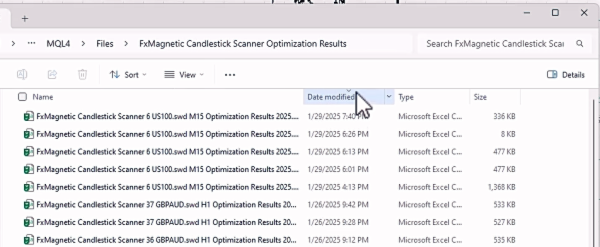
- Apply filters to your sheets to help you review the numbers.
When starting, aim for 50% win rate or higher, with a minimum risk to reward ratio of 2. You can adjust this as you go. The strategy’s profitability should be at an acceptable level for you, with a drawdown of less than 10%.
The spreadsheet contains a lot of important information which provides insight so you could make better decisions. Reviewing it regularly is the key to your success.
Autotrader Configuration
Upon attaching to the chart, the Autotrader automates the Candlestick Labs Scanner. This tool is useful when you want to live test your strategy without needing to get stuck at your screen.
Basic Setup:
- Locate Autotrader in the Expert Advisors list under the Navigator panel.
- Drag to the same chart where your scanner is attached.
- Input License Key.
- Select Indicator Sync Mode under EA Trading Mode (recommended default).
- Set a unique Magic Number for strategy identification under ChartName. This is useful if you are running different strategies. (Example: 1777, 10, 125, etc.)
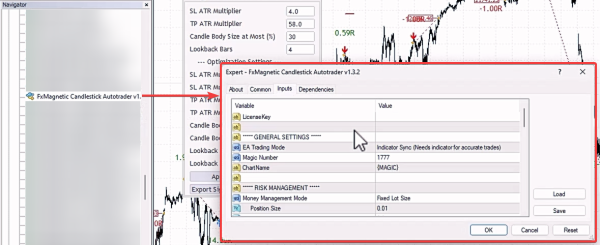
Risk Management Settings:
- For Money Management Mode, we suggest you choose Risk Per Trade (%)
- Set risk per trade (0.25% – 1% recommended). This lets the software calculate the lot size automatically.
- Verify lot size and margin requirements are displayed.
Verifying The Setup:
After confirming the setup (click OK), the auto-trader will print information on the top left corner of the chart. Note that the autotrader won’t work during the weekend. However, this will auto activate as soon as the market opens.

It is important to understand that the speed of the output varies depending on the frequency of signals produced. Example: 5 minute time frame gives more signals faster but most of these signals are low quality. Unlike the 4 hour time frame which is slow yet gives better quality signals.
Strategy Monitoring
Proper monitoring ensures strategy effectiveness and helps identify when adjustments are needed.
Performance Metrics:
- Monitor consecutive wins/losses
- Track win rate percentage
- Review profit/loss ratios
- Evaluate drawdown levels
- Watch trade frequency
Strategy Validation:
- Allow minimum 20-30 trades for statistical significance.
- Monitor for three consecutive losses (Potential warning sign if strategy backtest showed 3 consecutive losses in the past).
- Track each strategy’s performance separately.
- Compare results against backtest expectations.
Strategy Portfolio Management
Building a robust trading portfolio requires careful strategy selection and monitoring.
Portfolio Development:
- Begin with 2-3 strategies.
- Add new strategies gradually.
- Diversify across different:
- Currency pairs
- Time frames
- Trading instruments (forex, gold, indices)
Strategy Evaluation:
- Remove underperforming strategies.
- Keep successful strategies.
- Document performance metrics.
- Regular strategy review and optimization.
Tips For Success
- Higher time frames mean fewer but better trades – this is how real money is made in trading. The market wants you to overtrade on low time frames, but that’s often where traders lose. In short, quality vs. quantity.
- Be patient with results. Some strategies might need 5 days (or more) before you see your first winning trade. Understand this so you can avoid overtrading.
- Don’t immediately abandon your strategy when market behavior changes.
- A strategy with a high risk to reward ratio usually has long losing streaks, while a strategy with a low risk to reward ratio has less losing streaks. Your aim is to find a system that gives good return while keeping your drawdowns low.
- Never judge multiple strategies by overall account balance. A profitable strategy might be hidden by a losing one – track them separately.
- Think of strategies like a portfolio. When one isn’t performing well, others might cover for it. Start small, master a few strategies first, then gradually expand.
- A 100% win rate strategy does not exist. Keep this in mind so you can avoid over-optimizing. Aim for a strategy that has great stats where the win rate is high enough to be profitable.
